Great News for Email Users: Spam Rates Dropped by Nearly 10 Percent in October 2012

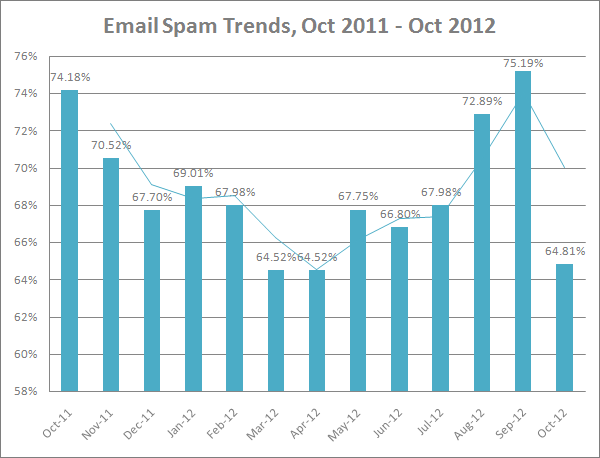
It is always interesting to explore the email spam trends across a large period of time, so this time we’ll compare spam rates within the last 12 months, from October 2011 to October 2012. Here comes the good news: the last month stats revealed an unprecedented drop in the email spam rate.

According to Symantec.Cloud data, the global spam rate dropped by more than 10%, from 75% of email traffic in September, down to 64.8% in October 2012. Please see the chart below to track the email spam trends from October 2011 to October 2012. As you can see, the last month’s spam rate is very similar to the “dead months” in 2011, March and April, when the percentage of spam messages went down to 64.52%.

email spam trends october 2011-2012


Reasons for the Sudden Drop of the Email Spam Rate in October 2012

As suggested by the editors of the latest Symantec Intelligence Report, one of the reasons for the sudden decline in email spam rates in October 2012 could be the disappearance of the Festi botnet which has apparently been hosted in Saudi Arabia in recent months.

By the way, if we take a closer look at the list of countries reported to be the sources of spam in October 2012, we are sure to notice that Saudi Arabia is no longer in the top ten list:

  1. India – 11.9%
  2. Brazil – 7.9%
  3. United States – 6.6%
  4. Canada – 5%
  5. Russian Federation 4.6%
  6. Vietnam – 4.1%
  7. Peru – 4%
  8. South Korea – 3.3%
  9. Romania – 3%
  10. Turkey – 2.9%

Unfortunately, drops like this one have been noticed before, but other botnets soon replaced the discontinued one, or a “dead” botnet was reincarnated.  We’ll see how it goes within the following months,and we can truly hope that the decline will become a steady trend.


Global Spam Categories in October 2012

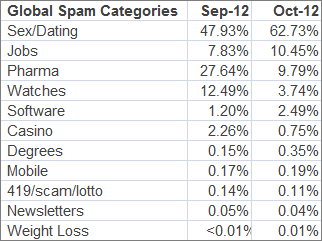
As we can see from the chart below, the Sex/Dating topic continued to be a leader in October 2012 and accounted for 62.73% of all spam messages. Jobs, Pharma and Watches stayed in the top 4 categories as well and only shifted places between each other: the Jobs topic was especially “popular” last month and accounted for 10.45% of all spam messages.

global spam categories,september - october 2012


Although email spam rates have recently shown a sudden decline, these rates cannot be compared to the small figures like 8% or 9% typical to the years 2001-2002. You can actually read our blog post on Email Spam Trends across 2001-2012 and feel nostalgic about the olden times…

So email spam is still a big problem both for companies and individuals. That means you still need a good time-proven solution to have a clean and organized Inbox. A good way to go is with EmailTray – an extremely smart email client that sorts all incoming emails and groups them under the Top Priority, Low Priority, No Priority and Spam tabs. EmailTray comes as a Windows email client and an Android email app, both of which are available for free. Get yours now and enjoy a more spam-free mailing experience.

Email Spam Rates in August 2012. How Do They Stack against the Previous Year Stats?

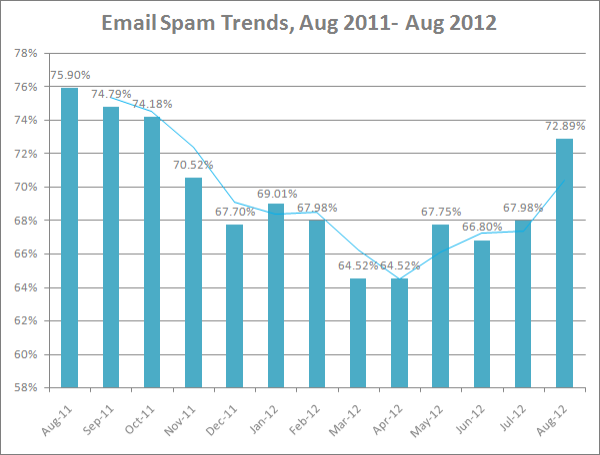
According to Symantec.Cloud data updated on a monthly basis, March and April 2012 were the lowest months for spam attacks within the last 12 months. As we can see from the chart below, May 2012 showed a rising trend and email spam reached a whopping 72.89% rate in August 2012. It is interesting that the spam rate in August 2011 was almost the same:  75.9%.

email spam statistics August 2011 - August 2012


Most Spammed Countries in August 2012

As stated in the Symantec Intelligence Report issued in August 2012, the highest volume of spam was detected in the electronic mail of Saudi Arabian users: 83.3% of all their mail was spam. Norway comes next in the list, with the rate of 78.1%. Chinese users received 77.6% of spam messages; Oman email users experienced a 77.3% spam rate and Brazil users – a 76.7% spam rate.

If we compare these figures to the Symantec’s email spam statistics dated August 2011, we’ll see the following:

Saudi Arabia – 84.8%
China – 81.6%
Italy – 81.3%
Russian Federation – 81.1%
Sweden – 78.8%.

As we see, email users from Saudi Arabia and China suffer from spam more often than the rest of the world.


Global Spam Categories in August 2012

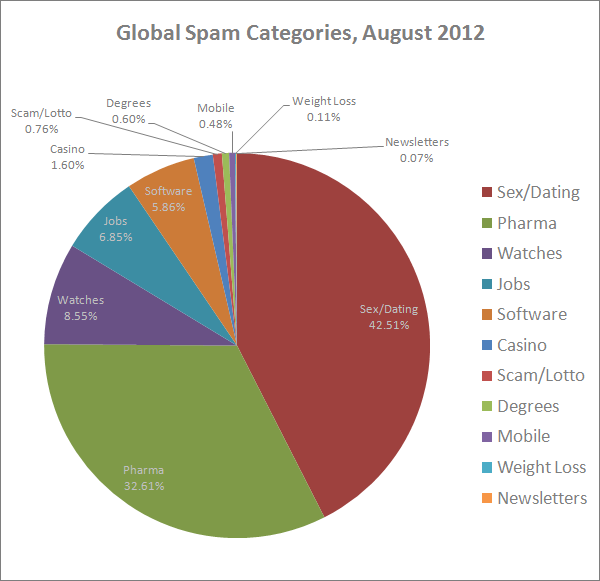
In August 2012, the most common category of spam was related to Sex or Dating, with a 42.51% share among all spam messages. Pharmacy-related messages took second place in the list – with the 32.61% share. The Watches category evened out the top-three list of the most popular spam categories, with a 8.55% share.  View the chart below to see how the other spam categories are represented in the list:

global spam categories, august 2012

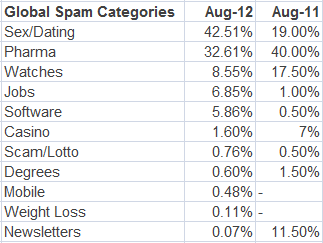
If we compare a Symantec’s Intelligence report issued in August 2012 to the same report issued in August 2011, we’ll see that the top three spam categories haven’t changed (Sex/Dating, Pharmaceutical and Watches), however Jobs and Software-related spam popped up this year:

spam categories compared August 2011--2012


How to Stop Email Spam

This topic deserves a standalone blog post, so we’ll highlight the most important points only:

  1. Do not give away your primary email address when registering online. Use a secondary or special address for registrations.
  2. Unless you are a salesperson, don’t include your email address in the public profiles visible by everyone.
  3. Choose an email address which is difficult to guess.
  4. Never respond to spam emails such as by asking to unsubscribe – this will confirm your email address validity rather than unsubscribe you.
  5. Use a spam filter on your computer or in your corporate network.
  6. Use the “Report spam” option within your email client so that you never receive emails from this sender again.
  7. Update your anti-viral software on a regular basis.

We never stop saying that you should also try EmailTray – not only because this is our offspring project, but also because it is a really smart email client offering powerful email prioritizing features. With EmailTray, you will be focused on good mail rather than junk mail, so go ahead and download EmailTray for Windows, or grab your smart email app for Android at GooglePlay!

Happy emailing!

Summer 2012: Email Phishing Trends Heat Up

Phishing has, unfortunately, become a part of our everyday life, whether we like it or not. Cyber attacks have become more refined and changed their modus operandi – they have now gone mobile and social. According to the yearly Norton Cybercrime Report issued in September 2012, cybercrime has been enjoying exponential growth within the last year and the direct costs associated with global consumer cybercrime at US reached $110 billion over the past twelve months.


The Calm before the Storm: A Spike of Email Phishing Activity in August 2012

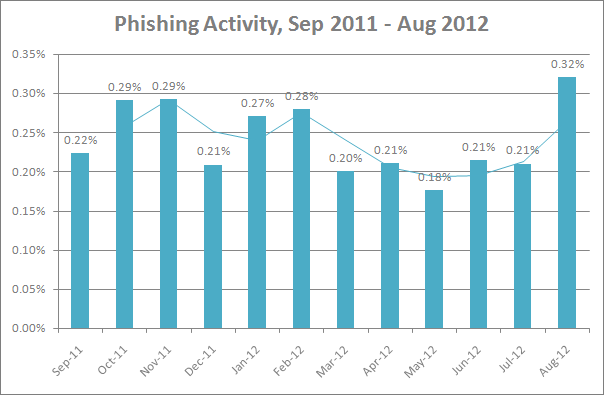
According to the monthly periodical Symantec.Cloud data, global email phishing rates stayed calm during the spring and most of the summer of 2012: 0.21% of all mail was detected as phishing in April, June and July; this rate was a bit lower in March and May (0.20% and 0.18% respectively). However August 2012 showed a spike in phishing activity and accounted for 0.32% of phish emails, or one in 312 messages analyzed.

See below a chart based on the Symantec data which traces the rising trend:

email phishing rates in summer 2012


Most Attacked Countries

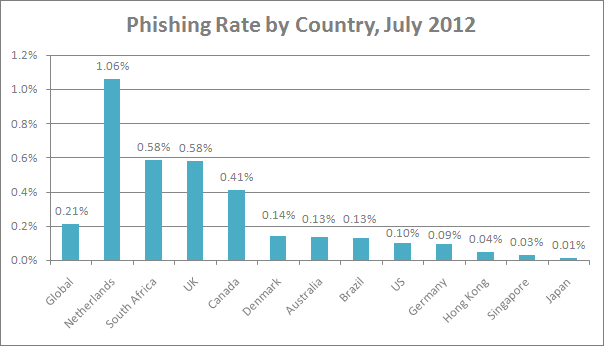
Month by month, the Netherlands remained the most attacked country in terms of email phishing attacks, and July 2012 was not an exception. According to the Symantec Intelligence Report, as of July 2012, one in 94.4 emails (1.06%) was identified as phishing in the Netherlands. South Africa was the second-most targeted country, with one in 171.2 emails (0.58%) identified as a phishing attack.

Phishing levels for the US reached one in 995.5 (0.1%) and one in 244.9 (0.41%) for Canada. In Germany the phishing level was one in 1,091.0 (0.09%); Denmark accounted for a 0.14% phishing rate (one in 719.6 emails). In Australia, phishing activity accounted for one in 752.1 emails (0.13%) and one in 2,241.4 in Hong Kong (0.04%). For Japan it was one in 7,448.8 (0.01%) and one in 3,450.6 for Singapore (0.03%). In Brazil one in 786.2 emails was blocked as phishing (0.13%).

email phishing rate by country July 2012, Symantec data


Organizations Spoofed in Phishing Attacks, by Industry

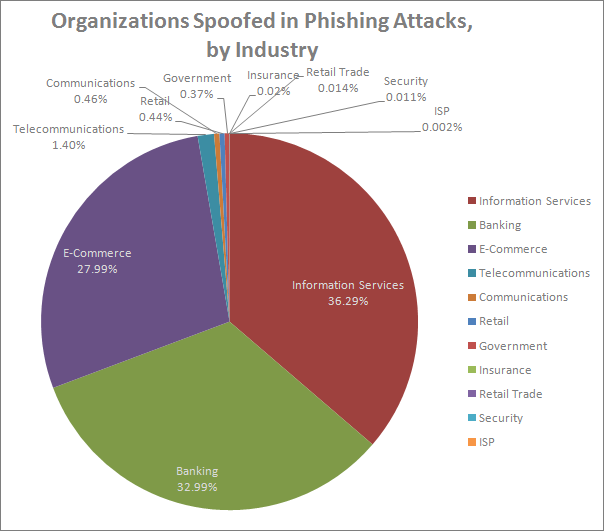
In July 2012, Information Services, Banking and E-Commerce were the most targeted industries among the organizations spoofed in phishing attacks: these industries accounted for 36.29%, 32.99% and 27.99% of all victimized companies respectively.

The other industries, from the most popular to the least popular, go as follows: Telecommunications (1.4%), Communications (0.46%), Retail (0.44%), Government (0.37%), Insurance (0.02%), Retail Trade (0.014%), Security (0.011%) and ISP (0.002%).

organizations spoofed by phishing attacks in July 2012, Symantec data

Do you find your industry in the list? Take preventive measures before cyber criminals tarnish your reputation. Use SSL certificates for your websites, assess your websites for vulnerabilities on a regular basis, ensure a strong password policy in your company and ask your employees to follow 5 simple rules of cyber security. Also, remember to install EmailTray as your smart anti-phishing email client on your PCs and Android devices. Then you can enjoy emailing which is free from spam and email phishing!

The Importance of Being Always Available via Email

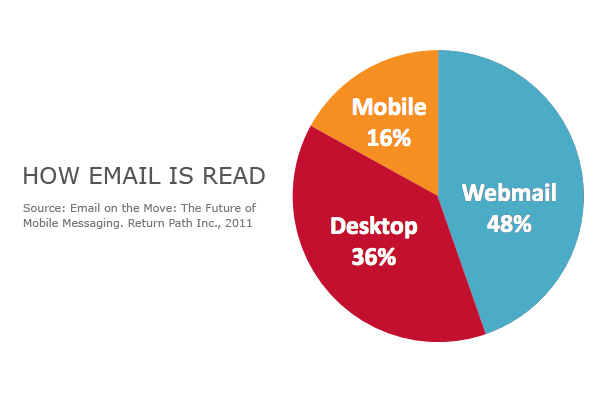
how email is read: webmail, desktop, mobile

Email is still one of the most popular modes of internet communication, but the sphere of its usage has slightly changed. Nowadays we get information about our friends and family mostly through social networks, whilst email is left for business communications. This business orientation has led to the increased use of email on mobile devices, because in the modern highly-competitive business world it’s really important to be always online and take action immediately with important messages.

The comScore research shows that 89.6 million Americans used their mobile phone to access email for work or personal purposes during the three-month average period ending November 2011, growing 28% from the previous year and representing an additional 19.5 million mobile email users.

Over half of “mobile workers” check their email on waking or immediately after getting dressed, – discovered May 2011 iPass survey.

Nielsen research on what mobile users do online showed email to be the most popular activity, accounting for 38.5% of mobile internet time.

Today email on mobile devices is an integral part of doing business. If you manage your email on a mobile device effectively, you may improve your business communications and get constant access to the information you need. When you answer your business emails immediately, you save seconds that create a competitive advantage in our rapidly moving world. Everything changes too quickly so you cannot allow yourself to separate your job from private life nowadays; you will mostly always need to be available via email so as not to lose opportunities. But nobody wants to become a robot that checks its inbox every second like an obsessed maniac. How do you find a balance between your need to read business emails quickly and your desire not to mix business and private life too much?

The EmailTray for Android app is the answer. Its main feature is smart analysis of your email communications that helps to sort your inbox (4 inboxes in this case) according to messages’ importance. With the EmailTray for Android app you read only the highest priority  emails and do not waste time deciding what messages you need to read and answer first. Besides smart sorting of emails, the EmailTray for Android app scans your Spam folder and rescues good emails that may have been trapped there by a spam-filter’s mistake. These features make you confident that all important emails immediately get to your inbox, sorted by sender priority, and ready to be answered.

Install the EmailTray for Android app to stay on top of this brave new, highly competitive business world.

Email Phishing Activity Over Time: 2004 – 2012 in Figures

Back in 2003, most of us faced only two types of email security threats: viruses and spam. Banking institutions, payment processors, online auctions and large e-stores didn’t really have to worry about being compromised by phishing attacks. The phishing industry wasn’t flourishing at that time. Regular email users were not put at risk of identity theft via fraudulent emails or malicious websites. That was a great time…

As noted in the MessageLabs Intelligence Annual Email Security Report, 2004 was “the year the big phish was landed”. In September 2003 the number of phishing emails detected by MessageLabs was 279. By September 2004 the figure had jumped to over two million. The main organizations targeted by phishing scams during 2004 were Citibank, HSBC, eBay, Visa, Natwest, ANZ and Westpac.


Email Phishing Rates 2004-2012: a Timeline of Evolution

According to a Symantec Intelligence Report issued in February 2012, the global phishing rate increased by 0.01 percentage points since January 2012, taking the global average rate to one in 358.1 emails (0.28%). The email phishing activity evolution is quite interesting to observe but is definitely disappointing to accept:
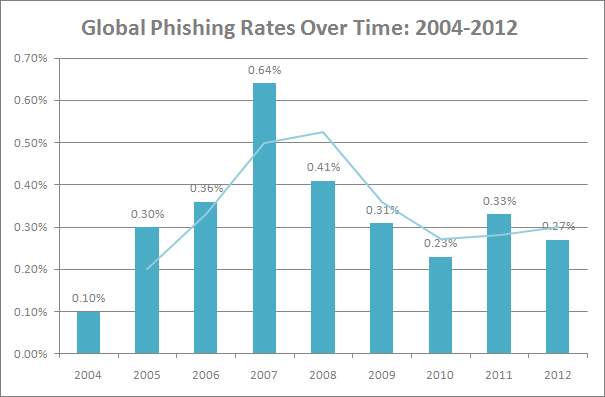
Email Phishing Rates 2004-2012

2004
As reported by the tech security company Messagelabs, phishing rates skyrocketed in 2004 due to the widespread use of zombie networks: the annual average of phishing emails reached 0.1%, or 1 in 943 emails. During 2004, MessageLabs intercepted over 18 million phishing emails (emails containing a URL to a fraudulent website).

2005
Phishing continued to be a major threat during 2005, accounting for an annual average of 0.3% or 1 in every 304 of all emails. MessageLabs intercepted around 2-3 targeted attacks per week during 2005; in 2004 this figure was almost negligible.

2006
Phishing continued to be a major threat during 2006, accounting for an annual average of 0.36% or 1 in every 274.2 of all emails.

2007
In 2007, the level of phishing attacks rose to 1 in 156.0 emails (0.64%) from 1 in 274.2 (0.36%) in 2006, an increase of 0.28%. Phishing attacks have widened their targets from defrauding major international banks and financial organizations to also targeting smaller, national and state banks, including credit unions.
Phishing attacks have also become much more targeted, using emails that include the recipients’ correct name and email address on the To: and Subject: lines. Furthermore, in some examples, the link included in the email encodes the email address of the recipient should they click on the link such that it is automatically passed to the phishing website.

2008
In 2008, phishing activity averaged around 1 in 244.9 (0.41%) emails, compared with 1 in 156.0 (0.64%) for 2007. Phishing activity peaked in February 2008 at 1 in 99.1 emails. This increase was due partly to the increased availability of plug-and-play style phishing kits that required very little technical skill to configure. Another factor was the increased use of specialized botnets for phishing activity.

The types of organizations targeted widened in 2008 and included recruitment agencies, online retailers and internet grocery sites.

2009
In 2009, one in 325.2 emails (0.31%) was a phishing attempt.

2010
In 2010, the average ratio of email traffic blocked as phishing attacks was 1 in 444.5 (0.23%), compared with 1 in 325.2 (0.31%) in 2009. Approximately 95.1 billion phishing emails were estimated to be in circulation during 2010. MessageLabs Intelligence tracked phishing attacks impersonating or relating to 1,530 different organizations, compared with 1,079 in 2009.

2011
In 2011, the overall phishing rate was 1 phishing email in 299 messages (0.33%).

2012
In February 2012, one in 358.1 emails was identified as phishing. That made up a rate of 0.27%, an increase of 0.01 percentage points since January 2012.


Most Attacked Countries

The Netherlands remained the country most targeted for phishing attacks in February, with one in 152.8 emails (0.65%) identified as phishing. Phishing levels for the US reached one in 753.5 (0.13%) and one in 427.9 for Canada (0.23%). In Germany phishing levels were one in 700.9 (0.14%), one in 461.9 in Denmark (0.22%). In Australia, phishing activity accounted for one in 499.9 emails (0.20%) and one in 1,045 in Hong Kong (0.10%); for Japan it was one in 4,762 (0.02%) and one in 689.9 for Singapore (0.14%). In Brazil one in 863.9 emails (0.12%) was blocked as phishing.
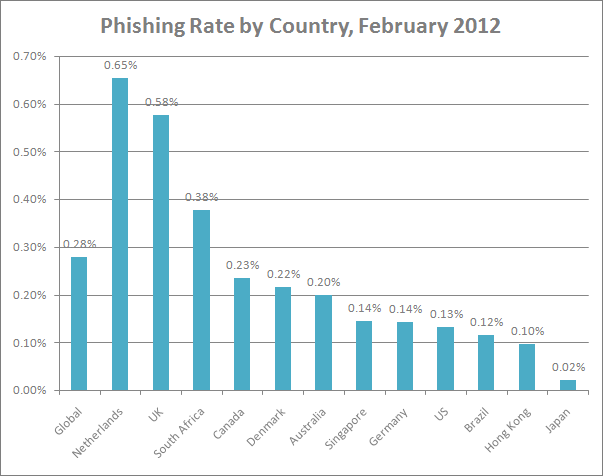
Phishing Rtaes by Countries


Most Attacked Industries

The Public Sector remained the most targeted by phishing activity in February, with one in 84.1 emails (1.19%) comprising a phishing attack. Phishing levels for the Chemical & Pharmaceutical sector reached one in 726.2 (0.14%) and one in 670.6 (0.15%) for the IT Services sector, one in 523.7 (0.19%) for Retail, one in 150.0 for Education (0.67%) and one in 328.6 (0.30%)for Finance.
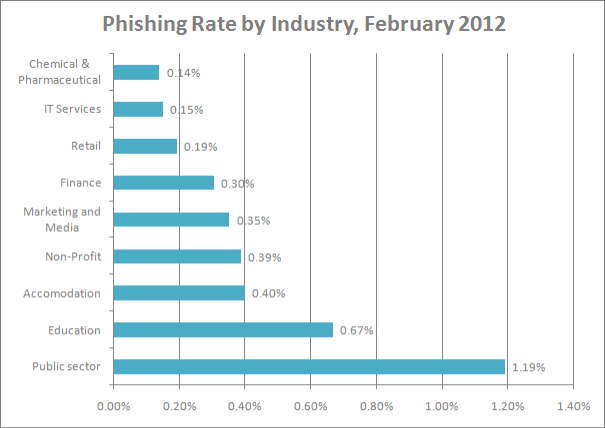
Phishing Rate by Industry 2012


Most Recent Phishing Alerts: May-June 2012

The FraudWatch International Service posts daily updates covering all phishing alerts detected by their system. Listed below are the phishing alerts detected by this service within the last two months:

June 21, 2012 Bank of America – Bank of America: Security Alert
June 21, 2012 Guaranty Trust Bank – Update Your Details
June 21, 2012 HSBC Bank – HSBC: New Security Measures.
June 21, 2012 Commonwealth Bank Australia – CommBank NetBank: Account security Notification!!!
June 21, 2012 HDFC Bank – Important Security Notification :
June 21, 2012 Commonwealth Bank Australia – CommBank NetBank: Account security Notification!!!
June 21, 2012 Lloyds TSB Bank – IMPORTANT-Lloyds TSB Customer Service Alert.
June 21, 2012 Internal Revenue Service (IRS) – Your IRS Tax Refund Status
June 20, 2012 Littlewoods – Increased credit limit
June 20, 2012 CIBC Bank – Please verify your account
June 20, 2012 Littlewoods – Increased credit limit
June 19, 2012 AOL – Your Account Has Been Disabled
June 19, 2012 Australian Taxation Office (ATO) – Australian Taxation Office Update
June 19, 2012 Earthlink – Your EarthLink Account Will Be Deactivated
June 18, 2012 NatWest Bank – NatWest Bank Alert: Unauthorized Access On Your Account.
June 16, 2012 Citizens Bank – Update alert
June 15, 2012 NatWest Bank – ALERT
June 15, 2012 Kiwibank – New Message from Online Banking
June 15, 2012 Kiwibank – ALERT
June 15, 2012 Citizens Bank – Verify Your Citizens Bank Online Account
June 15, 2012 PayPal – Your account PayPal has been limited until we hear from you
June 15, 2012 Kiwibank – New Security Update
June 15, 2012 Chase Bank – Chase Online Service : Changes To Your Online Banking
June 15, 2012 Halifax Bank – Update the Billing Information
June 15, 2012 NatWest Bank – There Is A Deposit Payment On Your Account
June 15, 2012 Halifax Bank – New Message from Halifax Online
June 15, 2012 Bank of America – New Security Update
June 08, 2012 Chase Bank – Important Notice !!!
June 08, 2012 Chase Bank – Dear Chase Customer (JP Morgan)
June 08, 2012 Bank of America – Online Banking Update
June 06, 2012 Kiwibank – Alert! Urgent Security Notice
June 01, 2012 BankWest – New Message from Bankwest

May 21, 2012 HSBC Bank – Access temporarily suspended
May 21, 2012 Santander UK – Santander Online Banking service
May 20, 2012 PayPal – Update required for your account
May 20, 2012 ABSA – Incoming EFT Payment
May 20, 2012 Halifax Bank – Halifax E-mail Verification !
May 18, 2012 RBC Royal Bank – RBC Royal Bank: You Have (1) Unread Security Message
May 17, 2012 Westpac Bank – Westpac Online Alert
May 17, 2012 RBC Royal Bank – Important notice !
May 17, 2012 Capital One Bank – You have one new message at Capital One.
May 17, 2012 West Coast Bank – West Coast Bank ALERT New security update
May 16, 2012 NAB – National Australia Bank – You Have 1 New Secured Message
May 16, 2012 Westpac Bank – Form Number xxxxxxxx
May 15, 2012 ABSA – New security message
May 15, 2012 Capitec Bank – Attention: Online Security Notice
May 15, 2012 Bank of America – Bank of America Alert: Security Update – your action required
May 14, 2012 Citibank – Unauthorized Access Notice
May 14, 2012 Bank of America – Customer Service
May 14, 2012 Commonwealth Bank Australia – account notice
May 14, 2012 Corporation Bank – CORP BANK !!! Update Your Login Information For Your OTP Registration
May 13, 2012 Halifax Bank – Irregular activity on your halifax online Account
May 10, 2012 Kiwibank – Your Account Is Temporarily Limited
May 10, 2012 SNS Bank – SNS Beveiligingsupdate

As you see, the most affected brands hit by phishing attacks during May 2012 – June 2012 were Kiwibank, Bank of America, Chase Bank, Halifax Bank, PayPal and NatWest Bank.


Tips for Businesses to Avoid Phishing Threats and Identity Thefts

There is no one universal solution to keep your digital data safe and guard, so your approach to security must be multi-layered:

  • Use highly secure Extended Validation SSL Certificates for your websites.
    EV SSL Certificates offer the highest level of authentication and trigger browsers to give users a very visible indicator that the user is on a secured site by turning the address bar green. This is valuable protection against a range of online attacks.
  • Use DNSSEC to preserve the integrity of the Company domain name system (DNS).
  • Regularly assess Company websites for vulnerabilities.
  • Use digital signatures in your outgoing emails.
  • Ensure that your employees secure and protect their code signing keys if they hold digital certificates.
    Make it a rule to store keys in secure, tamper-proof, cryptographic hardware devices.
  • Ensure passwords are strong; at least 8-10 characters long and include a mixture of letters and numbers. Encourage users to avoid re-using the same passwords on multiple Web sites and sharing of passwords with others should be forbidden.
  • Educate your employees about the various ways in which hackers use social engineering as a way to persuade users to click on malicious links.
  • Ensure that your employees never disclose any confidential personal or financial information unless and until they can confirm that any request for such information is legitimate.
  • Ensure that your employees review their bank, credit card, and credit information frequently for irregular activity.
  • Ask your employees to look for the green browser address bar, HTTPS, and recognizable trust marks when they visit websites where they login or share any personal information.

For more tips on how to avoid phishing and identity thefts, read 5 Simple Rules that Can Protect You from Cyber Crimes. You can also learn how the EmailTray email client may protect you from spam and phishing.
Email Spam Trends at a Glance: 2001-2012

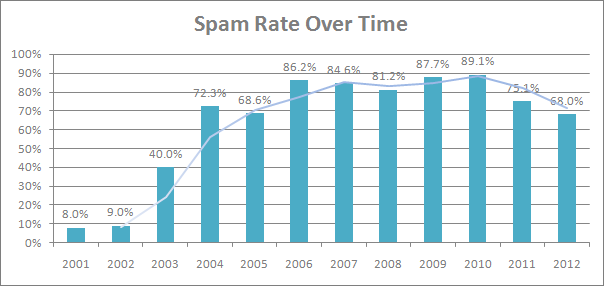
In a matter of just the past 10 years, email spam has become a multimillion industry. Despite a significant drop in email spam in 2011 (dropping to an average of 75.1% of all email in 2011 compared with 89.1% in the year of 2010), spam continues to be a serious problem for many companies and individual email users.


Email Spam Rate: Fluctuations Over Time

According to a Symantec Intelligence Report issued in February 2012, global spam levels continued to fall, as it now accounts for 68% of global email traffic. If we compare these figures to the data from the previous years’ reports, we’ll see that the email spam rate has been continuously decreasing within the last three years:

Email spam trends 2001-2012: rate over time, peaked in 2010

Back in 2001, about 8% of all mail was identified as spam. In 2002 this figure was 9% or 1 in 11.During 2003, MessageLabs Anti-Spam service identified 40% of emails scanned as spam.

The overall spam trend for the first half of 2005 saw a leveling of spam in line with the 2004 yearly figure of 72.3%, with an annual average percentage of 68.6% emails being identified as spam.

One of the key developments in 2006 was a significant increase in spam activity, with levels reaching 86.2%, the highest experienced since 2001.

2007 was the year when botnets came of age. The overall spam trend for 2007 was around 84.6%. Total spam levels averaged 81.2% for the year 2008.

But in 2009 the annual average spam rate was 87.7%, an increase of 6.5 percent on the 2008 statistic. In 2010, the average global spam rate for the year was 89.1%, an increase of 1.4% compared with 2009.

In 2011 the spam rate dropped to an average of 75.1% of all email. The dramatic decline, beginning December 25, 2010 and continuing through January 1, 2011, was the result of both a halt in the spam-sending activities of three botnets – Rustock, Lethic and Xarvester – as well as unrest among pharmaceutical spam-sending gangs.

In the current year of 2012, spam levels have continued to decrease, reaching 68% of all mail in February 2012. Of course things might change by the end of the year and show a totally different picture. However we’ve been observing a descending trend within the last three years so far.


Most Spammed Countries

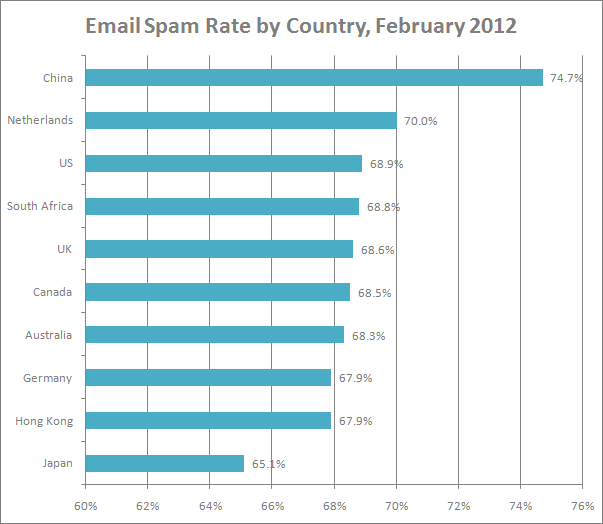
In February 2012, the highest volume of spam was detected in the electronic mail of Chinese users: 74.7% of all mail. Residents of The Netherlands found a 70% rate of spam messages among their mail. In the US, 68.9% of email was spam; South Africa accounted for 68.8% of spam. UK email users faced 68.6% of spam. Canada and Australia reported slightly lower figures: 68.5% and 68.3% respectively. 67.9% of spam was reported by Hong Kong users as well as users from Germany; Japanese users experienced 65.1% of spam in their mail.

Email spam trends 2001-2012: rate by country, China leads in February 2012


Top Spam Categories

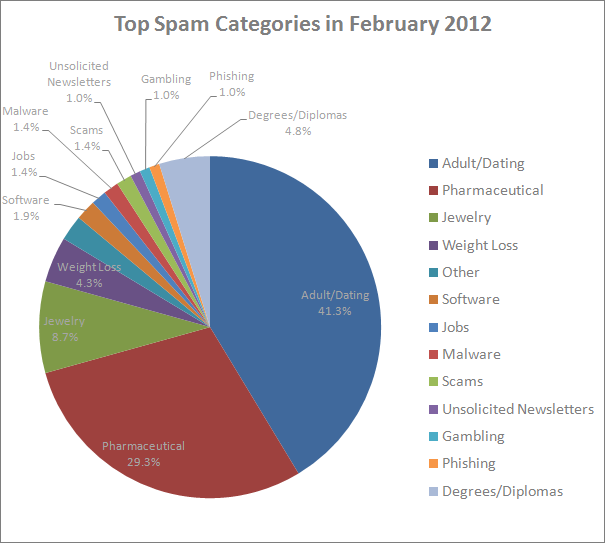
According to a Symantec Intelligence Report issued in February 2012, the most common category of spam was related to the Adult/Dating category, overtaking pharmaceutical related spam for the first time:

Email spam trends 2001-2012: top spam categories, Adult/Dating leads in February 2012

There were particular grounds accounting for the shift in email spam categories. Between 2010 and 2011, pharmaceutical spam fell by 34%, in large part owing to the demise of the Rustock botnet, which was mainly used to pump-out pharmaceutical spam. In contrast, messages about watches and jewelry, as well as sex and dating, both increased as a percentage.